Supporting Tools
Website analysis
The analysis of a website is about the detailed mapping and evaluation of the behavior of its visitors. For example, you can derive statistics and information such as:
-
- How many are the visitors to the site.
- Which is the country / city of origin and their demographics (age, gender, etc.).
- What is their behavior on the site (abandonment or deepening rates, residence time, etc.).
- What content / product caught the attention of visitors.
- What the impact of an ad campaign was (eg Google AdWords).
- How did they find the site (search engines, advertising, referral links, social networks).

By evaluating the traffic statistics of your website, you can optimize its content.

SEO check
SEO – Search Engine Optimization – defines all the modern techniques applied to a website to improve its ranking in search engine results.
To optimize a website, we study its performance on many parameters, such as:
- Technical features: Website speed, mobile friendly, duplicate content avoidance, readable permalinks, visitor interaction, clean code, proper use of keywords, meta-tags, alts, headings, etc.
- Structure and Content: How to Write Texts, Quality of Information, Rate of Renewal, etc.
- Existence of backlinks, that is, hyperlinks to other websites that send to yours.
We control the SEO of your website and suggest the best technical solutions to get you to the top of the Google results.
Content writing
Content Writing requires multidimensional knowledge such as Marketing, SEO, Social Media Marketing, Text Editing, etc.
At Netgraphics we undertake writing or editing support for any form of digital media, such as:
- web sites
- blogs
- posts on social media
- press releases – announcements
- newsletters.

A good and thoughtful text attracts readers, creates images and emotions for them, and causes them to republish it on social media. This increases your website traffic and provides you with free visibility.

Infographics
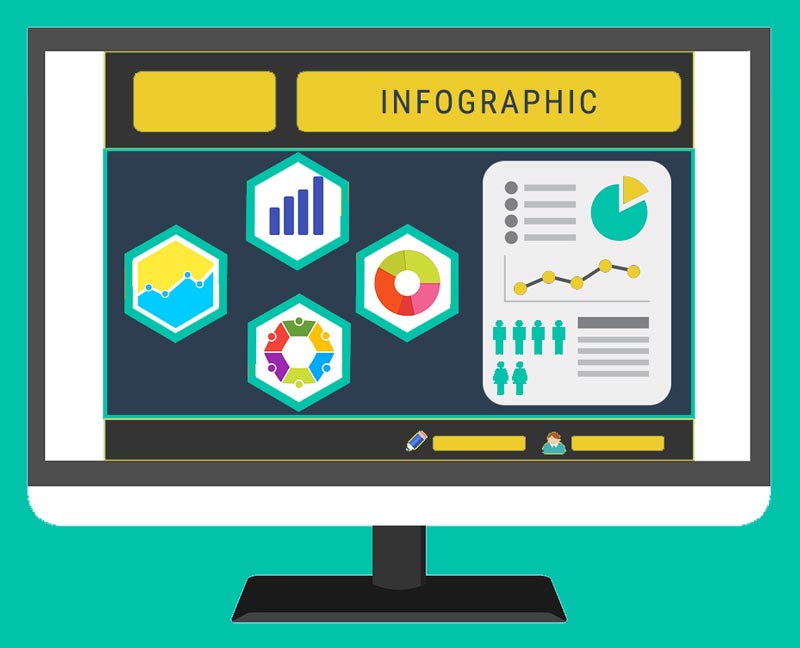
Infographics are a clever way of summarizing information using graphics and color.
- Make complex information more accessible.
- They bring out the most important elements of a research without tiring the reader.
- They are easily imprinted in memory.
- They create recognition.
- They attract more recipients.
- They get more response on social media.
Infographics can be integrated into a communication strategy (social media, newsletters, advertising banners, Power Point presentations, leaflets, etc.) as well as in presenting research results (articles, news, research papers, presentations, posters).
Creating presentations
We design and create presentations for conferences, information events, undergraduate theses, etc., in order to attract more audiences. We are particularly careful:
- the structure of the presentation
- editing the text, using appropriate language and keywords
- graphic design of the presentation, incorporating logos, graphics and infographics
- choosing the right colors to match the profile of a business
- choosing the right and perfect font size.

A good presentation should bring out an idea, while keeping the interest of the audience undiminished.

Email Signature
Digital E-mail signature is a clever way of summarizing the professional position and contact details of any modern professional.
- It contains information that your email recipients can access at any time.
- It contains links to your business website and social networks, increasing traffic and followers.
- It incorporates the company logo, thereby increasing its brand recognition.
- It shows professionalism.
Facebook Insights Analysis
We analyze your professional Facebook page by looking at Facebook Insights. We study in particular:
- the demographic profile of your followers (geographical origin, age, gender, etc.)
- the posts that got the most likes
- the posts that received the most comments
- user response rates during peak hours
- the percentage of users who visited your site
- the percentage of users who used directions to find you on the map
- the percentages of your followers compared to those of your competitors.


Online surveys
Conducting a survey with online questionnaires is widely accepted. It is a method that takes much less time to conduct, analyze responses and evaluate its results.
- Filling out the questions quickly and pleasantly.
- The number of participants and their responses is increasing.
- The answer collection process is automated.
- The answers are automatically imported into a database.
- The results are analyzed and visualized in the form of graphs (geographical distributions, pies, bars, etc.).

